Environmental monitoring on open satellite data. Outline a site, pick an analysis, and get a dated, georeferenced result with the imagery that made it — in minutes, without buying a scene.
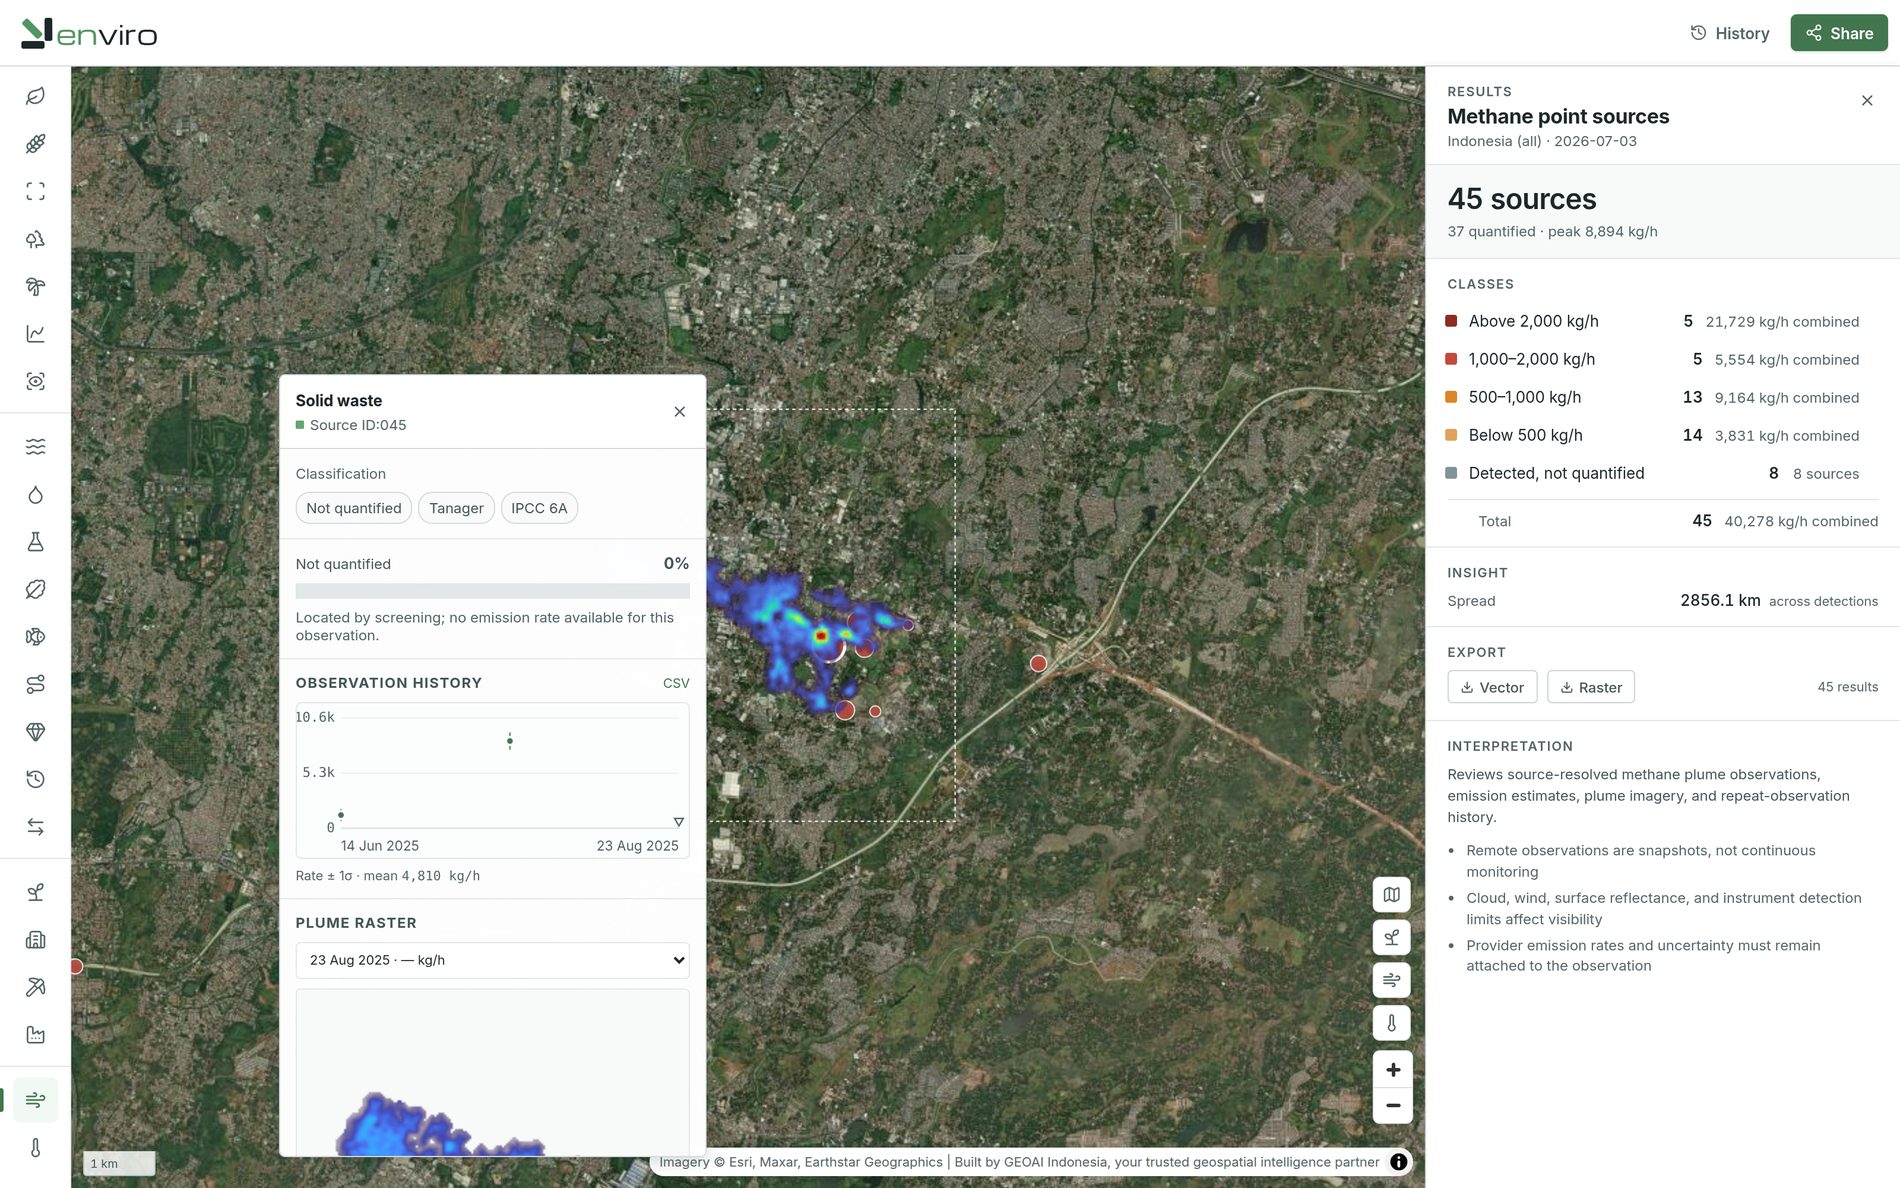
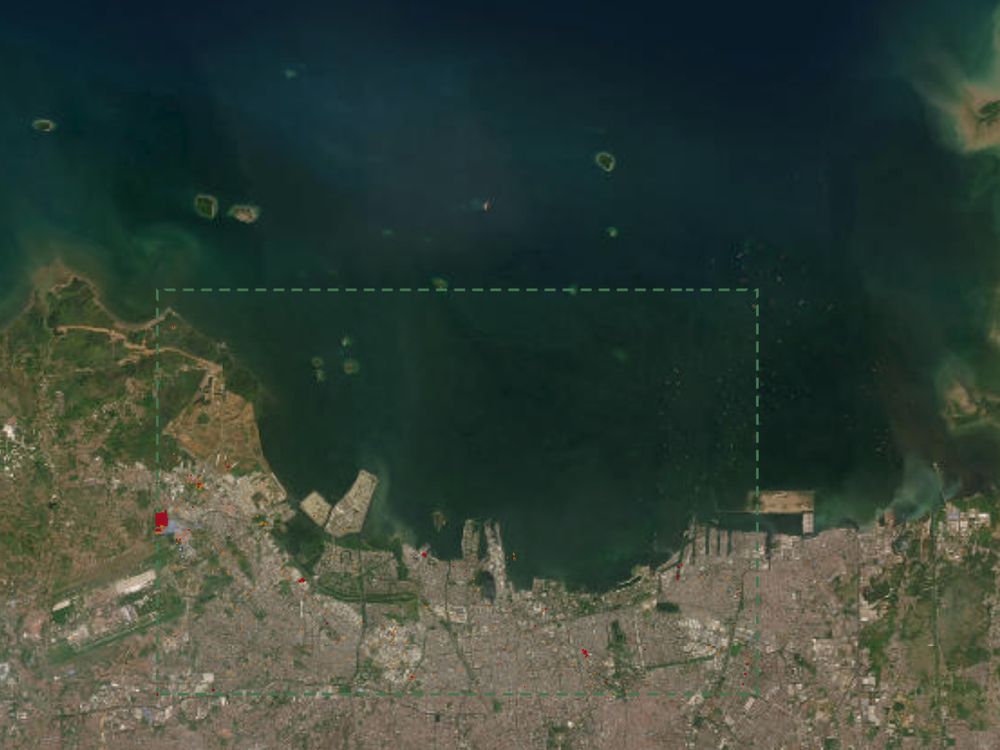
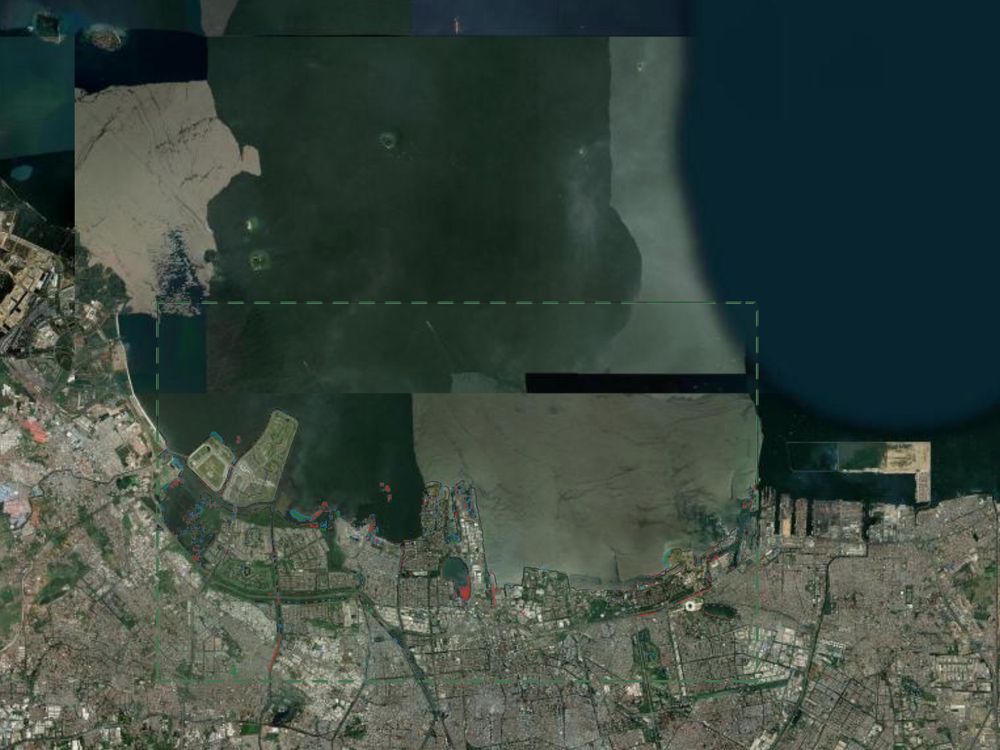
Live capture · methane point sources · Bantargebang, Bekasi
Built on public science, not proprietary black boxes
CarbonMapper
The problem
The data is already free. Turning it into an answer is not.
01
Open data, closed workflow
Sentinel-2 and Carbon Mapper are public. Getting from there to a defensible number still means scene search, cloud masking, seasonal compositing, band maths and someone who does this for a living. That person is booked for the next six weeks.
02
Consultants deliver reports, not monitoring
A survey tells you what was true last quarter. Ponds get dug, canals get cut, clearing starts and stops between site visits. By the time the PDF lands, the ground has moved.
03
Dashboards show layers you cannot defend
When an auditor, a validator or a regulator asks how a figure was produced, “the platform said so” is not an answer. Most tools cannot show their method, their inputs, or the dates they used.
How it works
One frame: area in, evidence out.
The same four steps whether you are looking at methane plumes or mangrove loss. Your team learns it once and gets every analysis.
1
Draw your area
Sketch it on the map or pick a saved site. Concessions, mangrove belts, catchments, districts, anything you can outline. Enviro shows the size and the resolution it will work at before you go on.
2
Choose the analysis
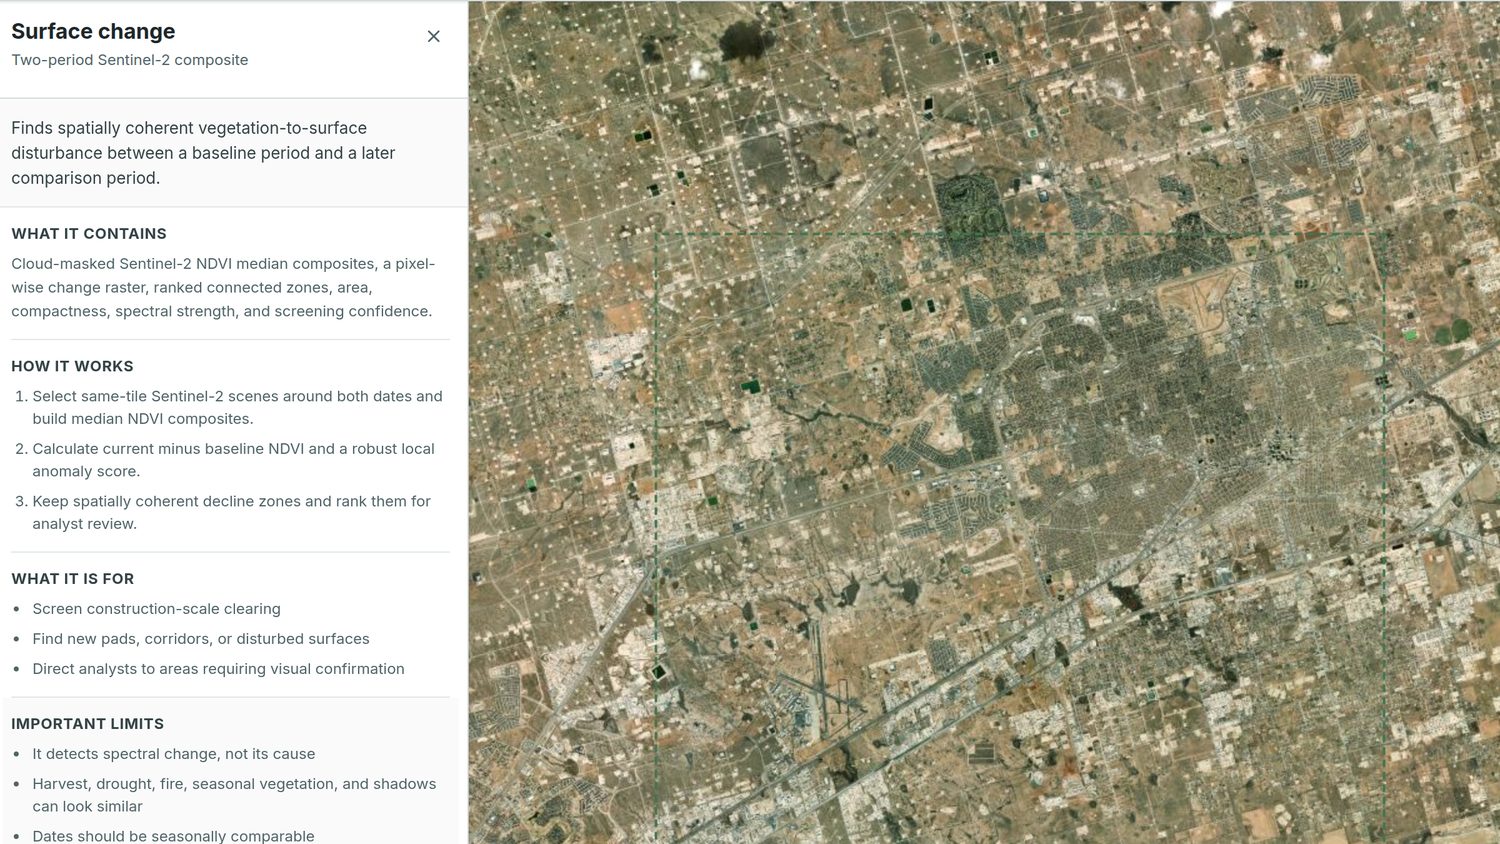
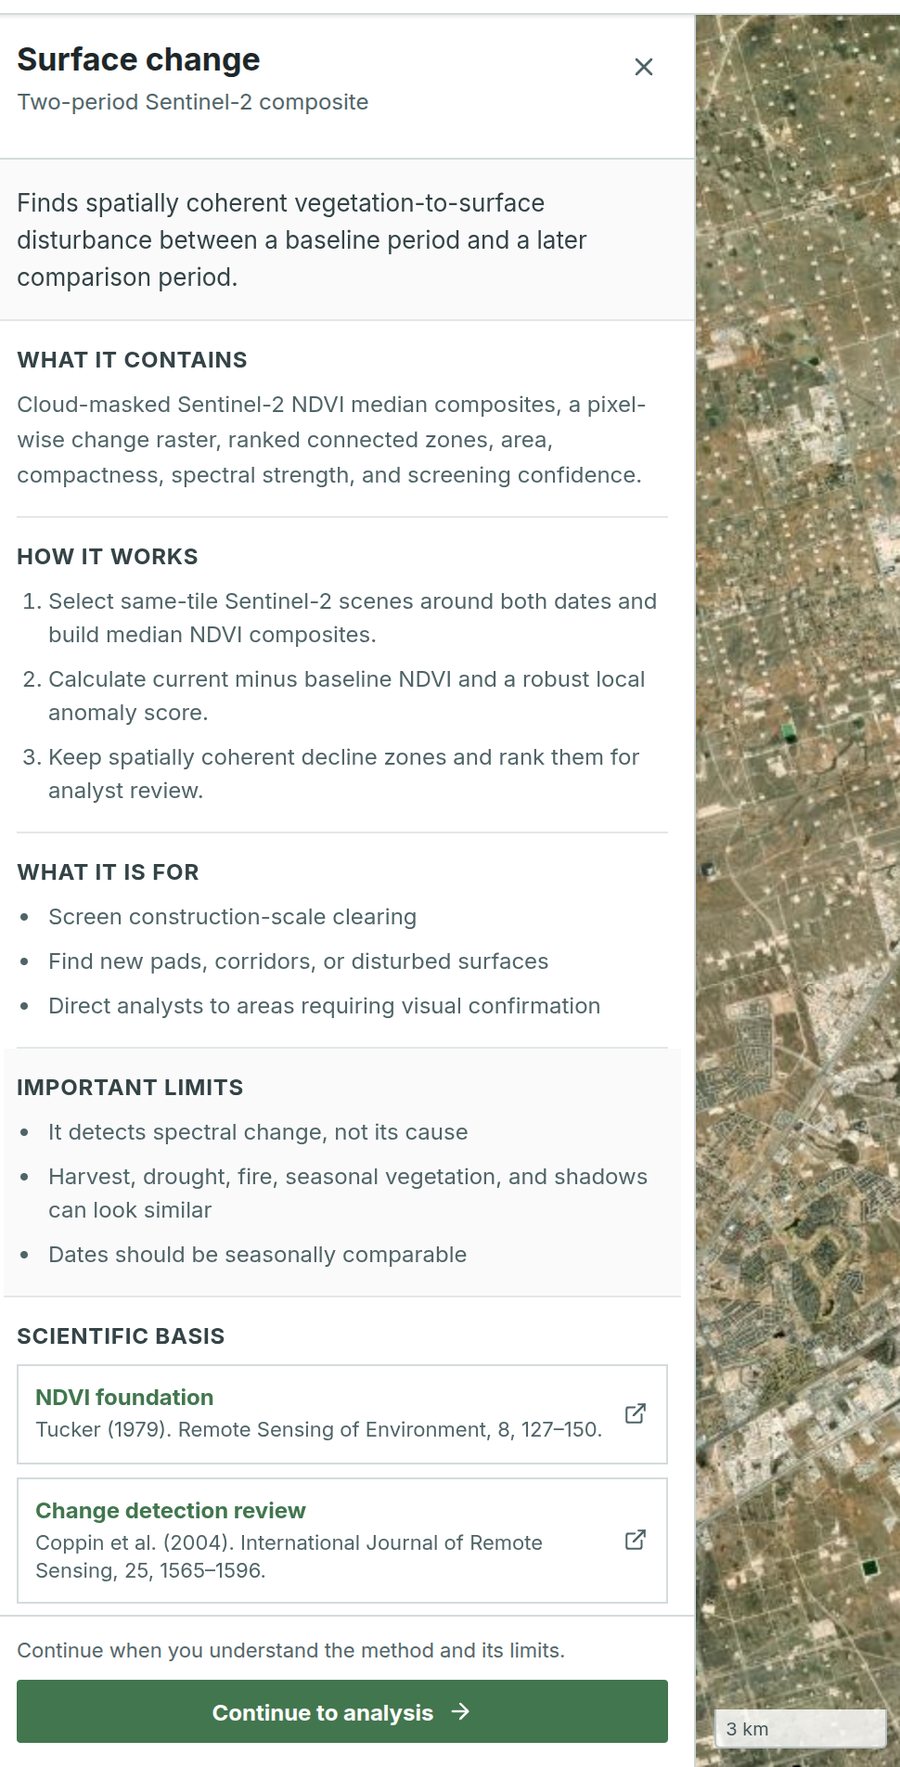
26 analyses, from mangrove trajectories to methane point sources. Each one opens with what it contains, how it works, what it is for, and the limits it carries, before you spend a run on it.
3
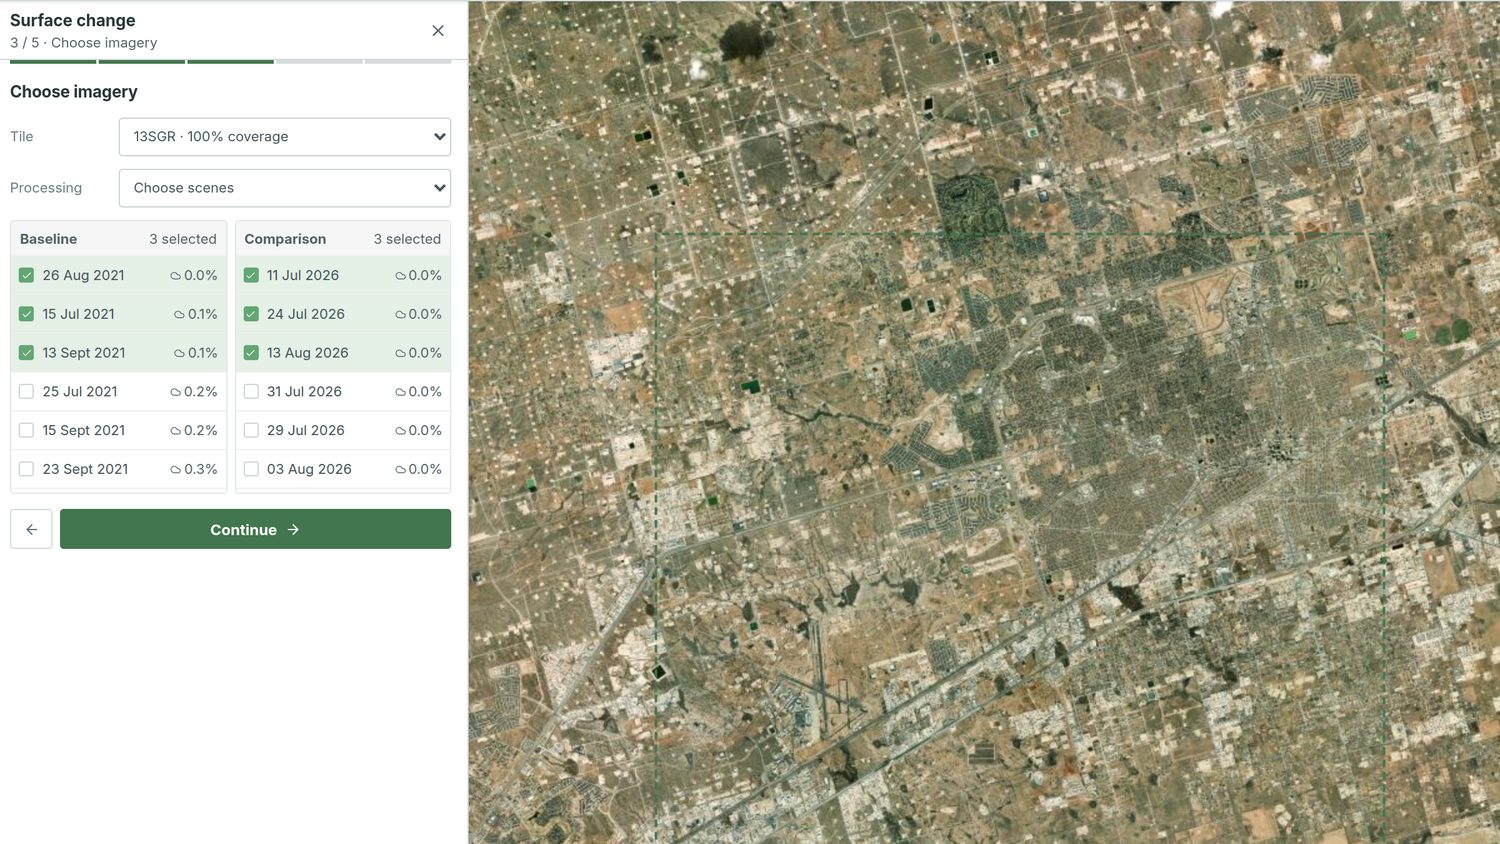
See the imagery before you commit
Every usable acquisition is listed with its date, cloud cover, coverage of your area and tile. Take the recommended full-coverage set, hand-pick up to five scenes, or pin one exact acquisition.
4
Read the result, then export it
A georeferenced overlay plus per-feature numbers: area, change magnitude, confidence and footprint. Inspect them on the map, then download the CSV for the audit file.
The registry
26 analyses, live today.
This is the core of the product. Every one runs on the same four steps, states what it can and cannot tell you, and wears the same icon here as it does in the workspace.
Imagery
A clean true-colour look at your area on a date you choose.
Surface change
Vegetation that turned to bare surface between two periods.
Built-up surface
Where hard, built surfaces have appeared.
Exposed ground
Soil and rock with the cover stripped off.
Industrial site lifecycle
Whether a site is opening up, holding, or growing back.
Burn severity
How hard a fire hit, zone by zone.
Forest trajectories
Loss that persisted, loss that is recovering, and canopy that came back.
Vegetation health
Where greenness has fallen against the baseline.
Vegetation phenology
Growth running ahead of or behind its own season.
Canopy condition
Canopy that is thinner than the vegetation around it.
Canopy stability
Canopy that keeps flickering rather than holding steady.
Moisture stress
Vegetation drying out relative to its neighbours.
Oil palm plantations
Plantation extent, attributed to the named concession holder.
Mangrove trajectories
Three-period mangrove loss, recovery, and regrowth.
Shoreline change
Coast that retreated and coast that advanced.
Aquaculture ponds
Regular water bodies that look like ponds, mapped and counted.
Drainage canals
Straight, narrow water features cut through peat and swamp.
Water change
Open water gained and lost between two dates.
Water dynamics
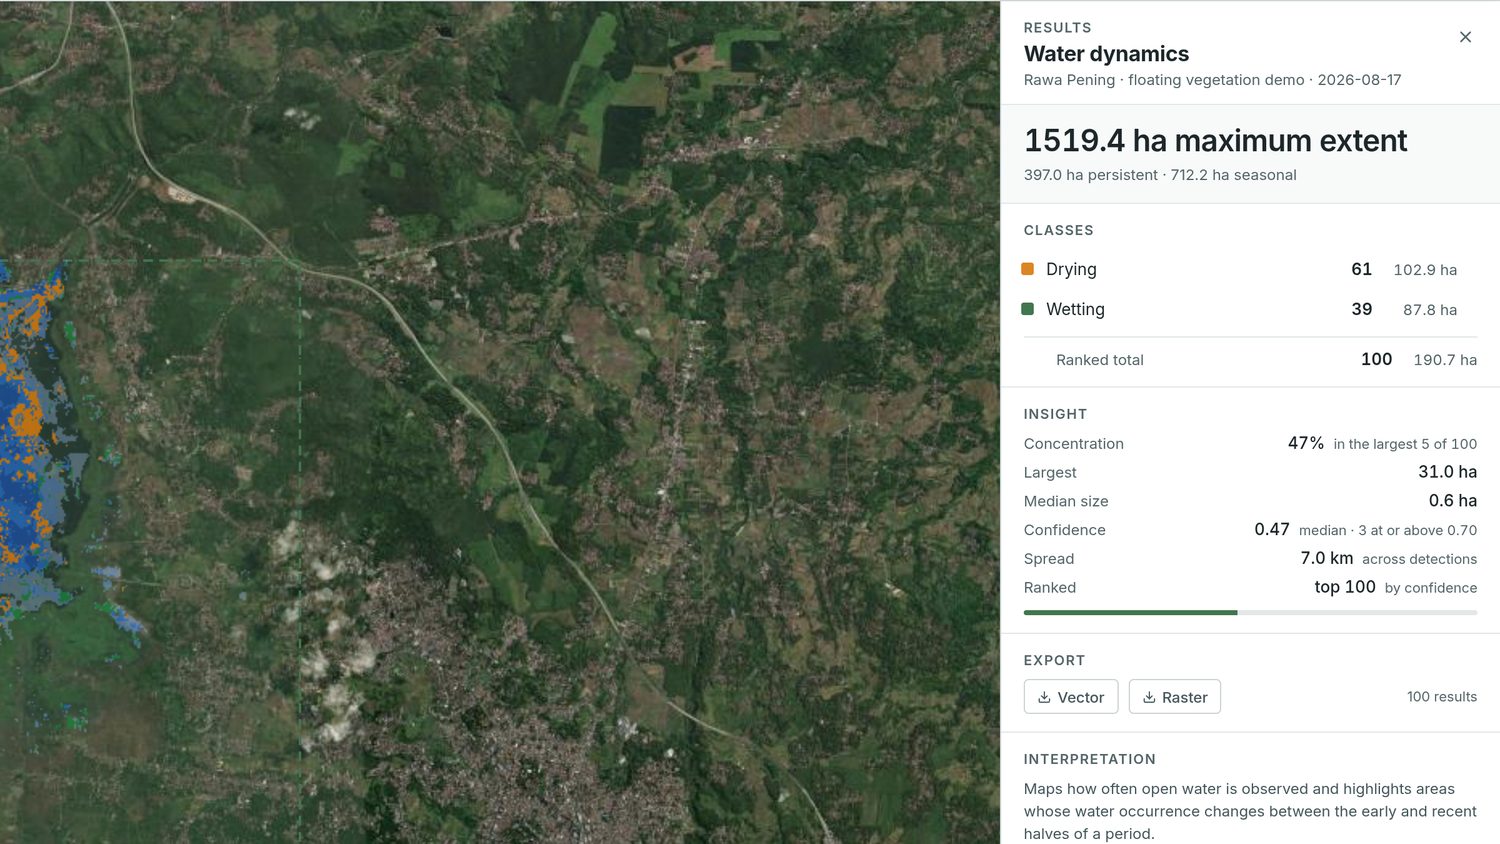
How often water is there: permanent, seasonal, drying, wetting.
Turbidity screening
Water carrying an unusual load of sediment.
Algal signal
Surface water with a bloom-like signal.
Floating vegetation
Mat-like cover sitting on open water.
Mining pit water
Ponded water inside pits and voids.
Methane point sources
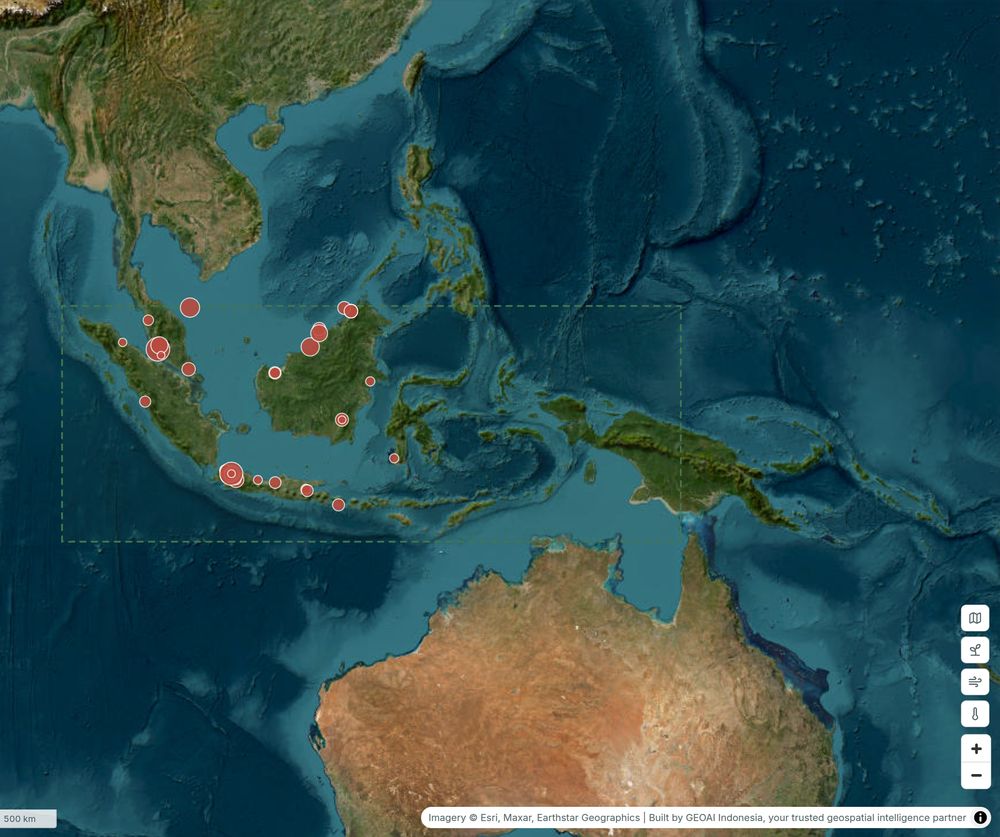
Plume observations clustered into sources you can watch over time.
Industrial heat sources
Hot spots that recur in the same place across passes.
Live environment
Wind, temperature and soil moisture over the area, right now.
Showing all 26 analyses.
Real runs, real numbers
Every figure below was produced by the platform.
Not mockups. Each result carries the imagery, dates and parameters that made it, and states what it is not.
Methane point sources45 sources · 37 quantifiedPeak 8,894 kg/h, 40,278 kg/h combined, and 8 sources detected but deliberately left unquantified.
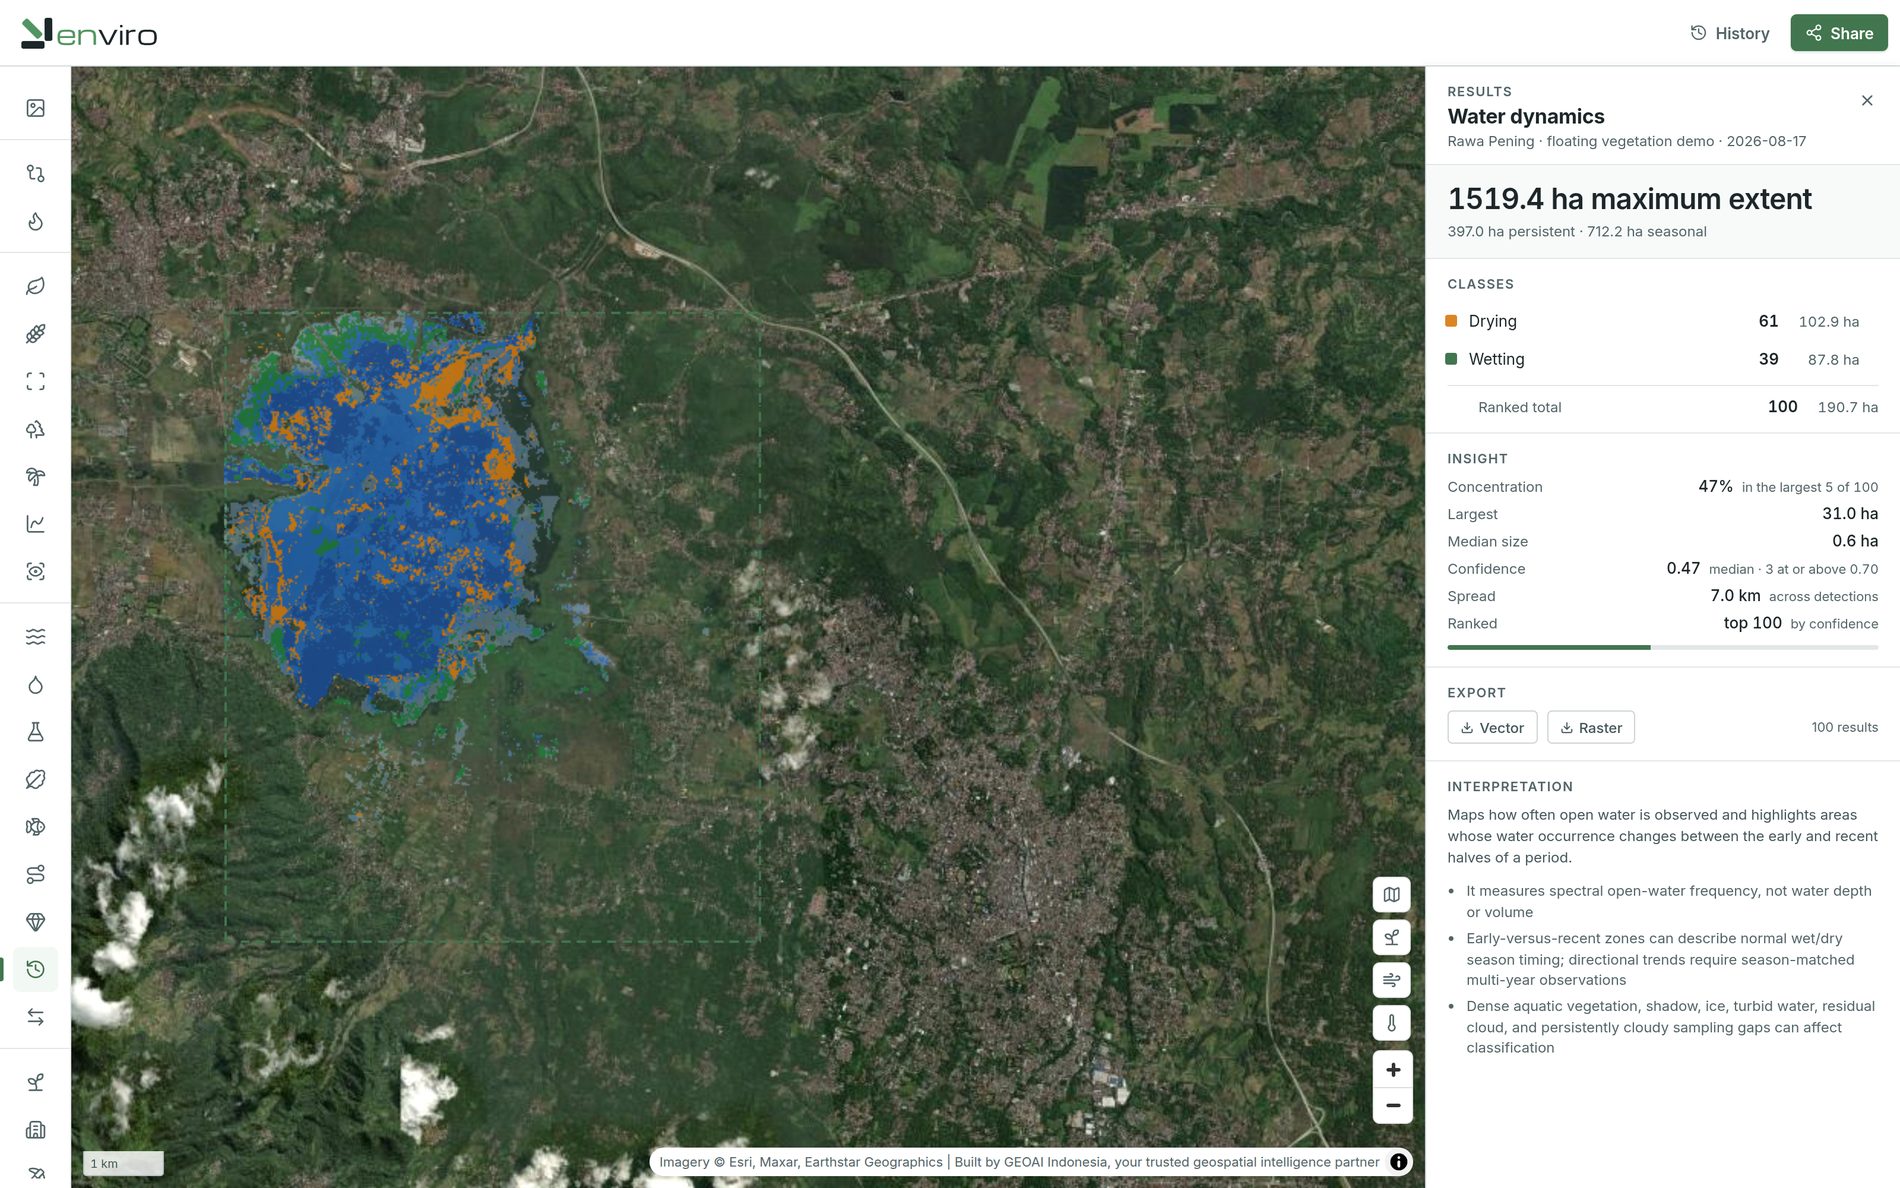
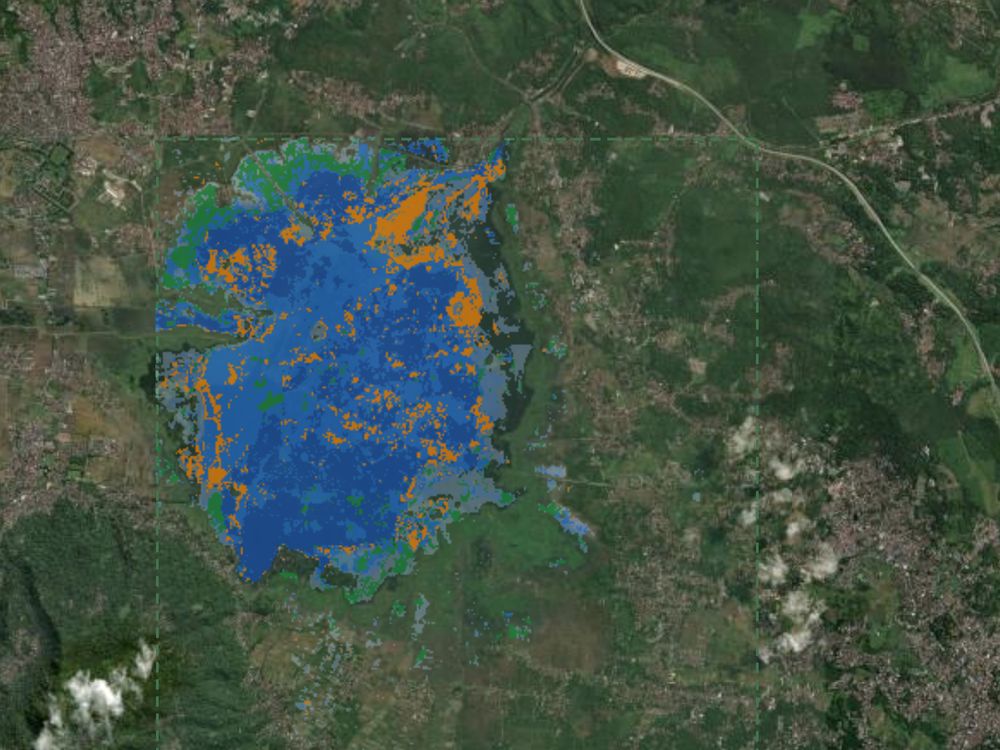
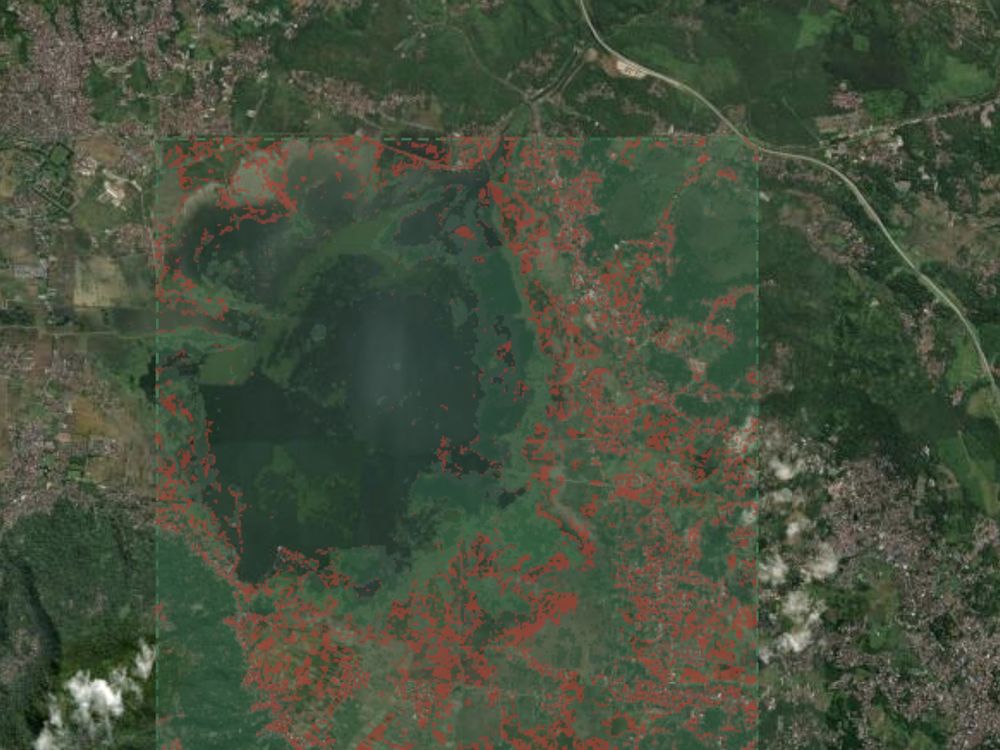
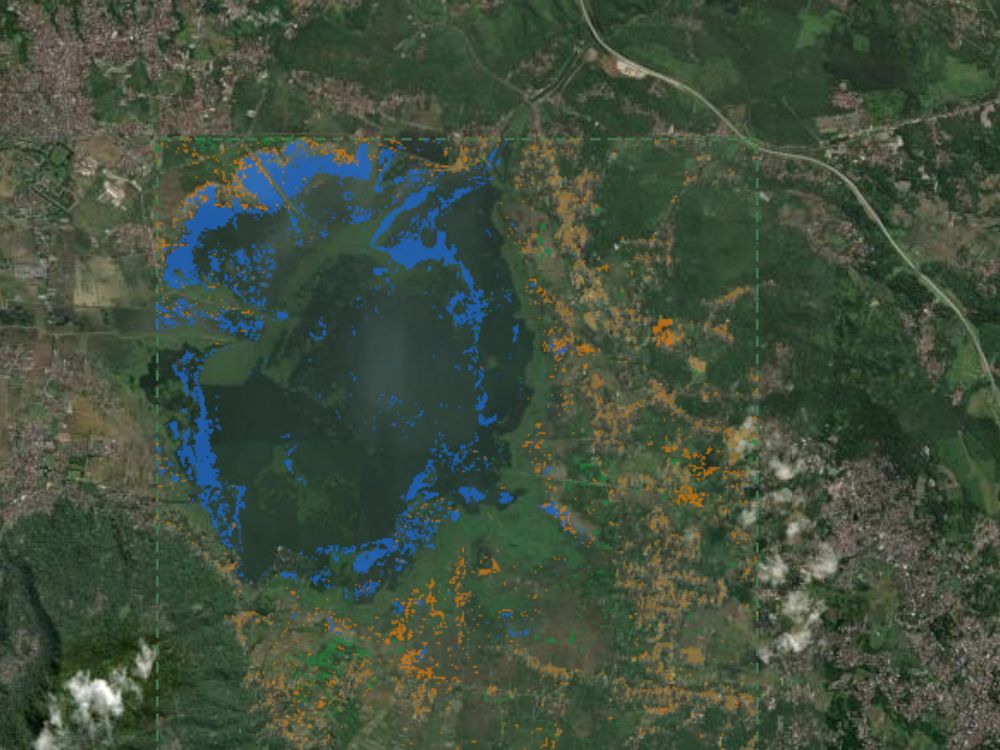
Water dynamics1,519.4 ha maximum extent397.0 ha persistent, 712.2 ha seasonal; 61 drying and 39 wetting zones. Rawa Pening, Central Java.
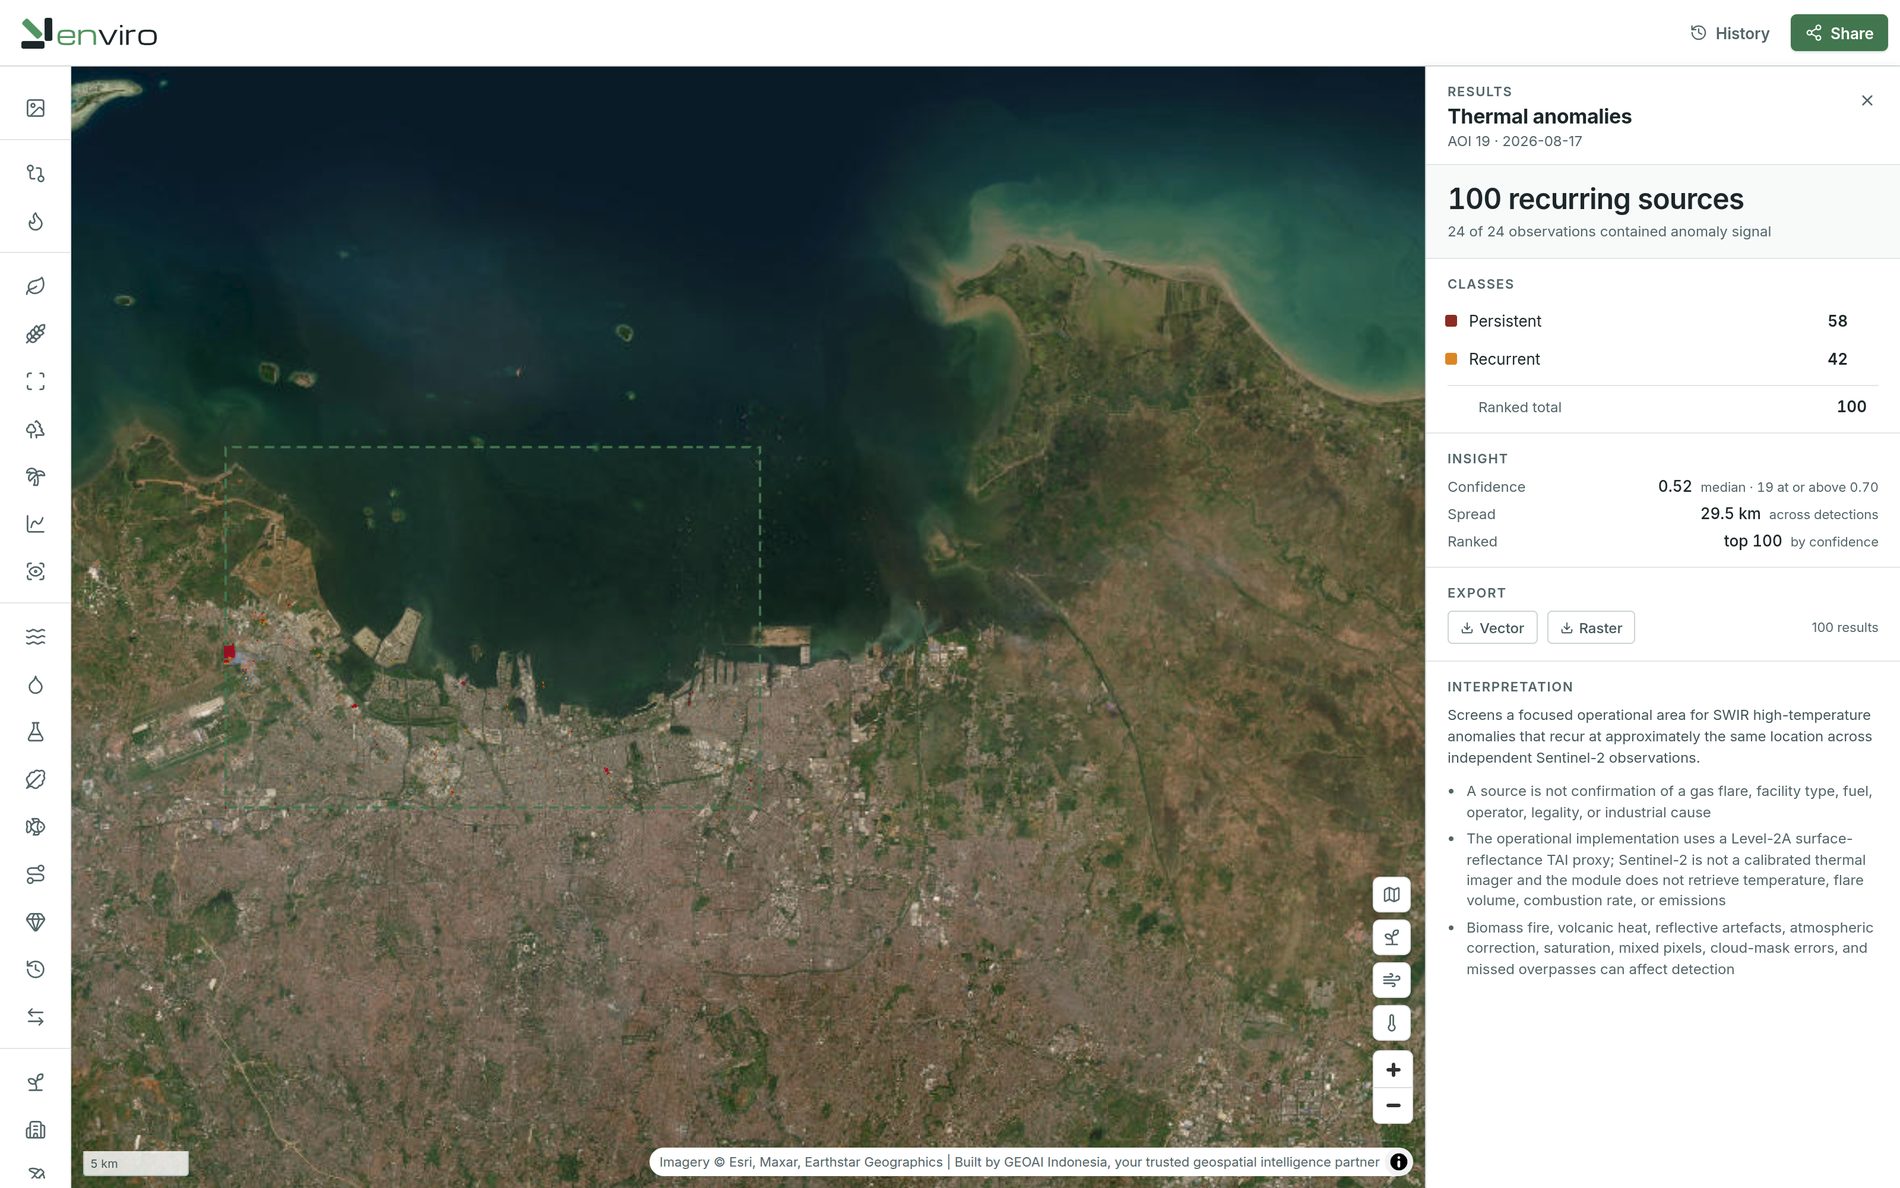
Industrial heat sources100 recurring sources58 persistent, 42 recurrent, across 24 of 24 observations. Not a flare, a fuel or a temperature. A recurrence.
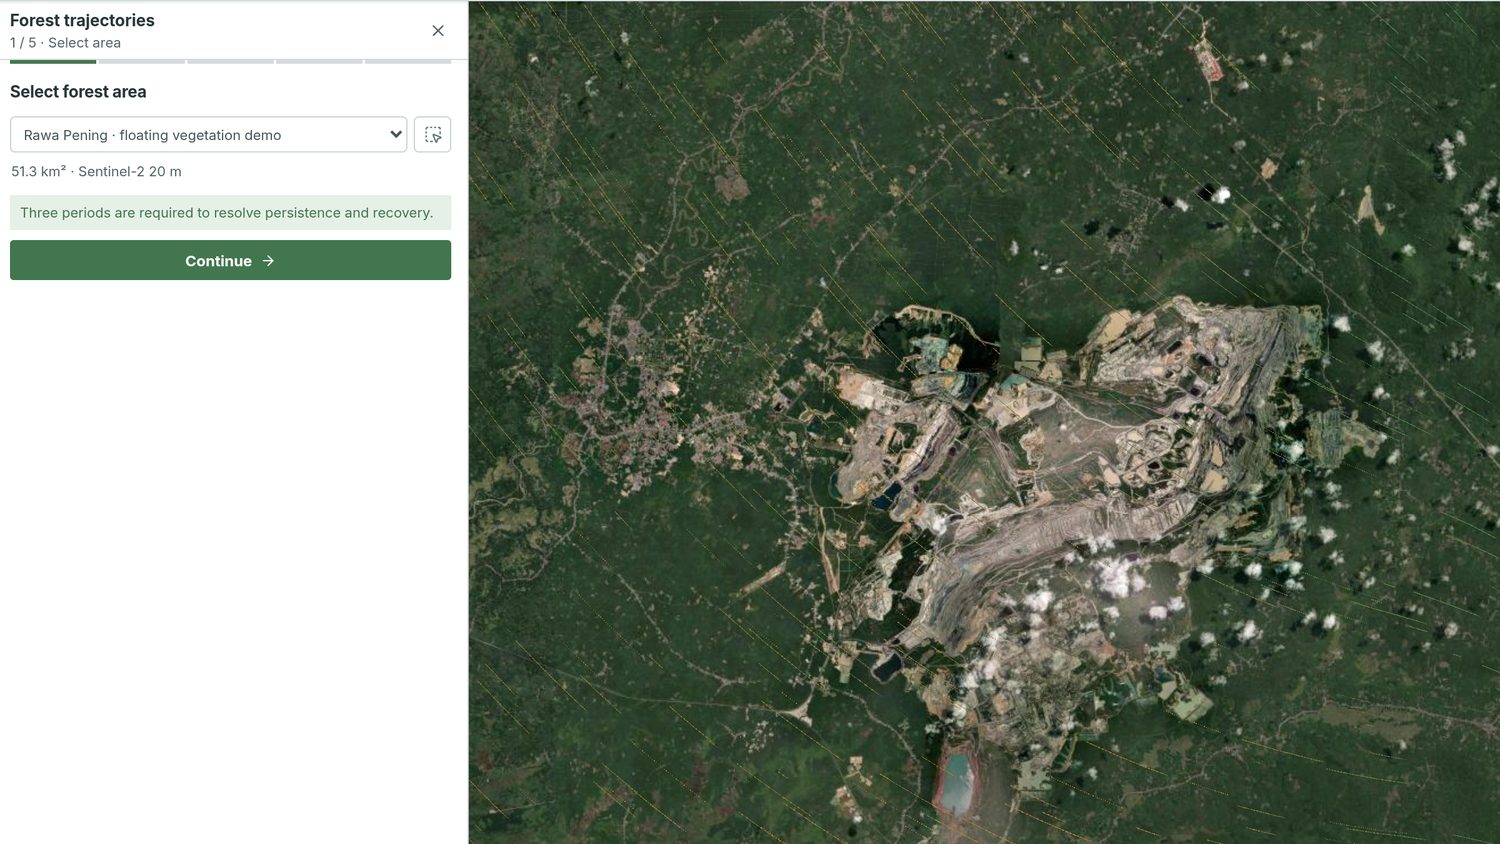
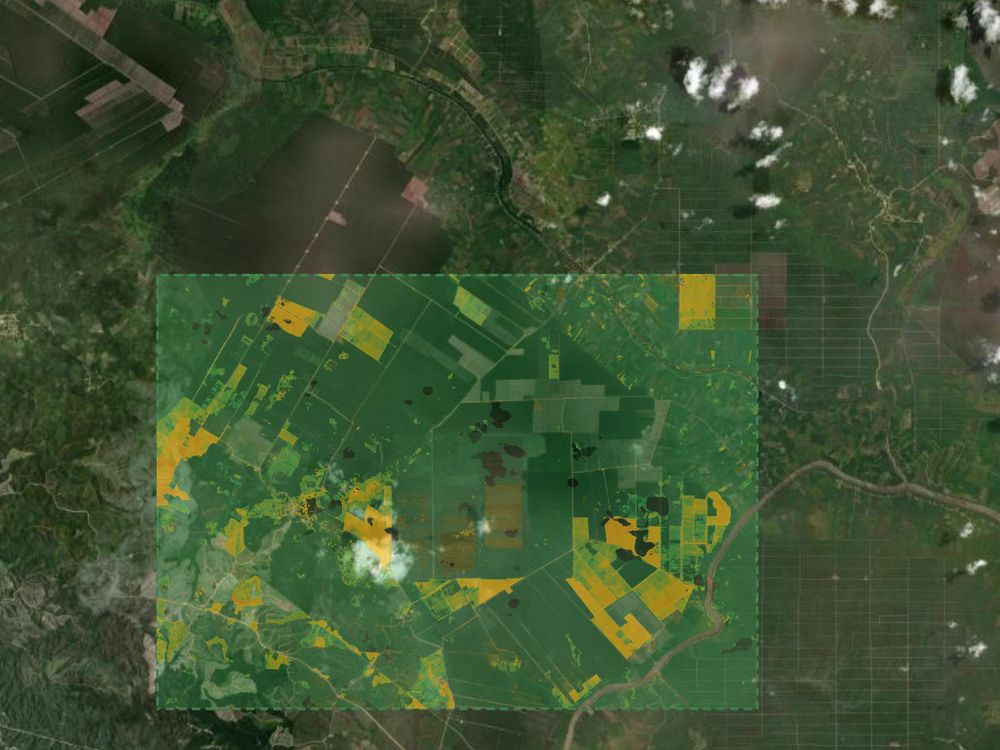
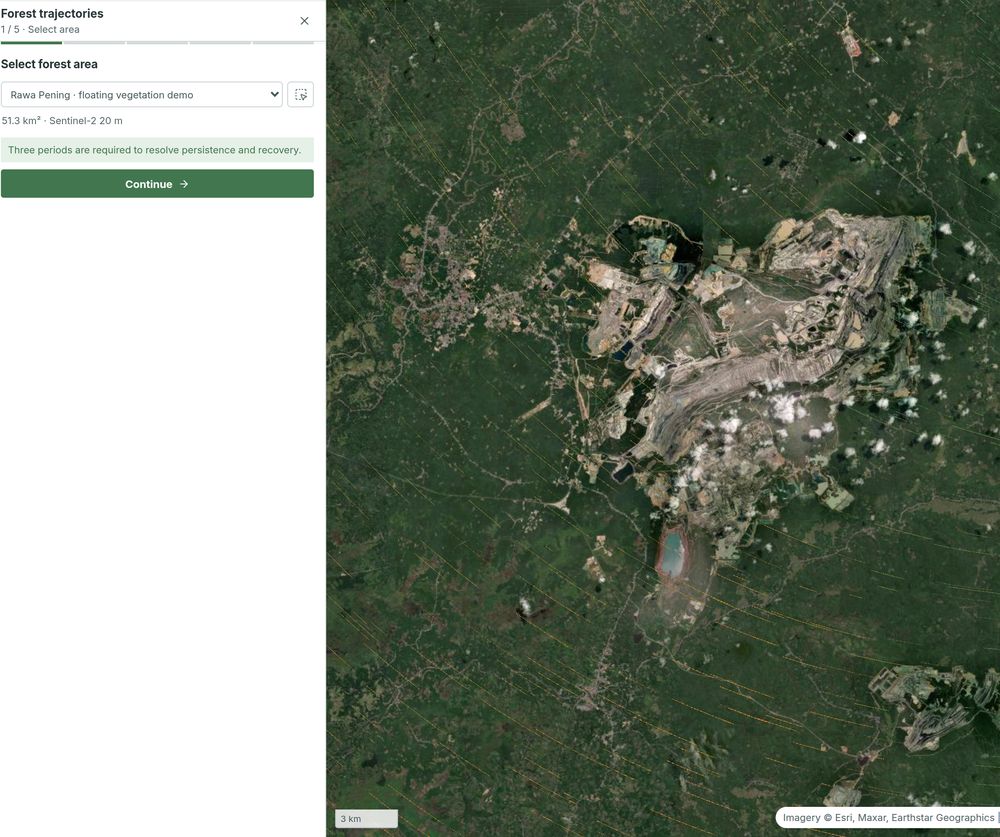
Forest trajectories52.4 ha persistent loss26 zones across three periods: 21 persistent loss, 1 recovering, 4 recovered. 19.5 ha recovering.
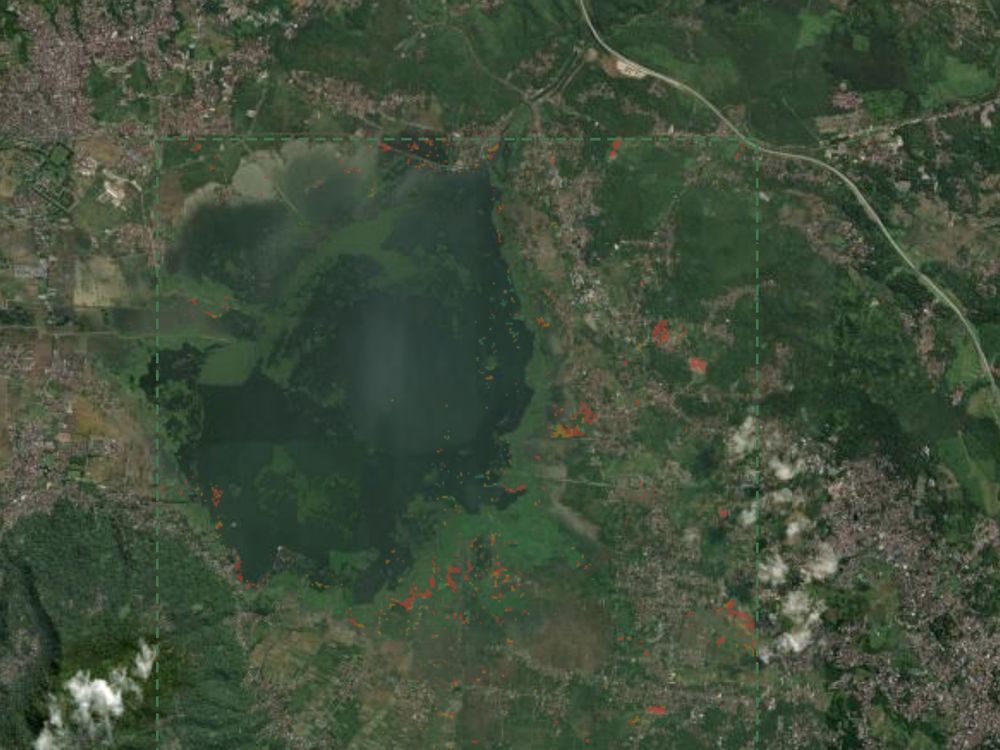
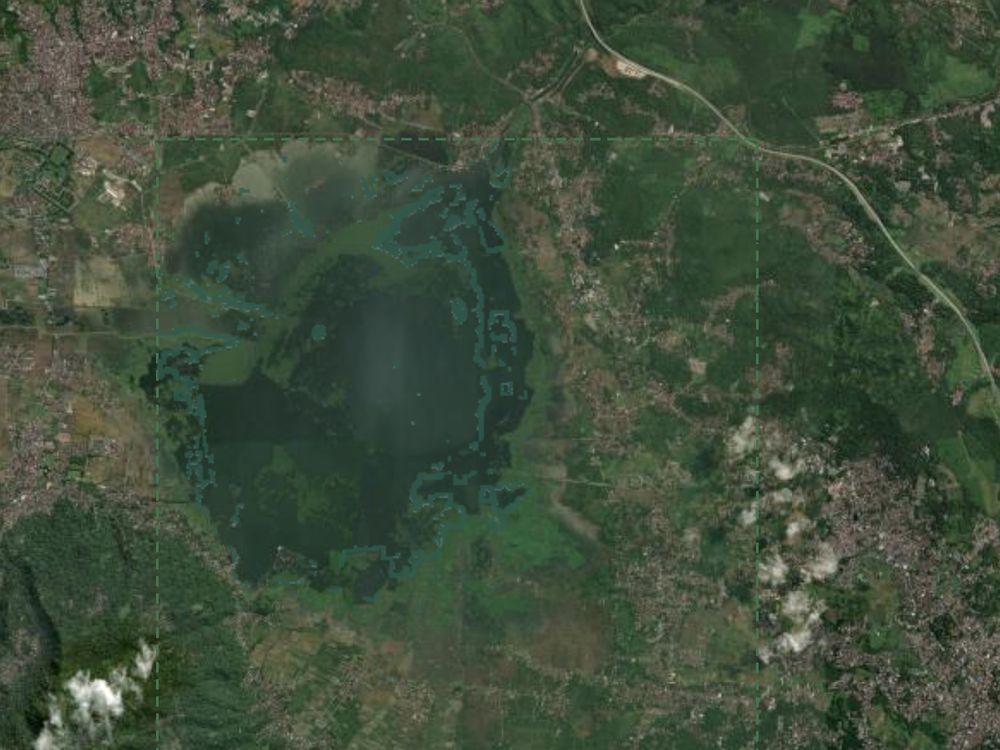
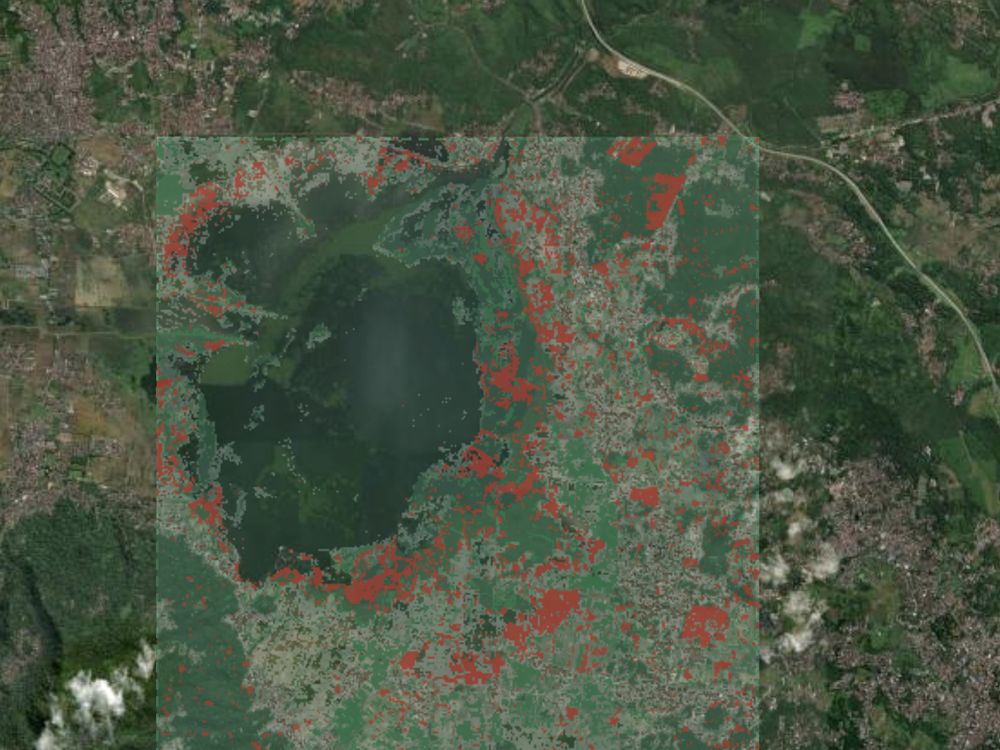
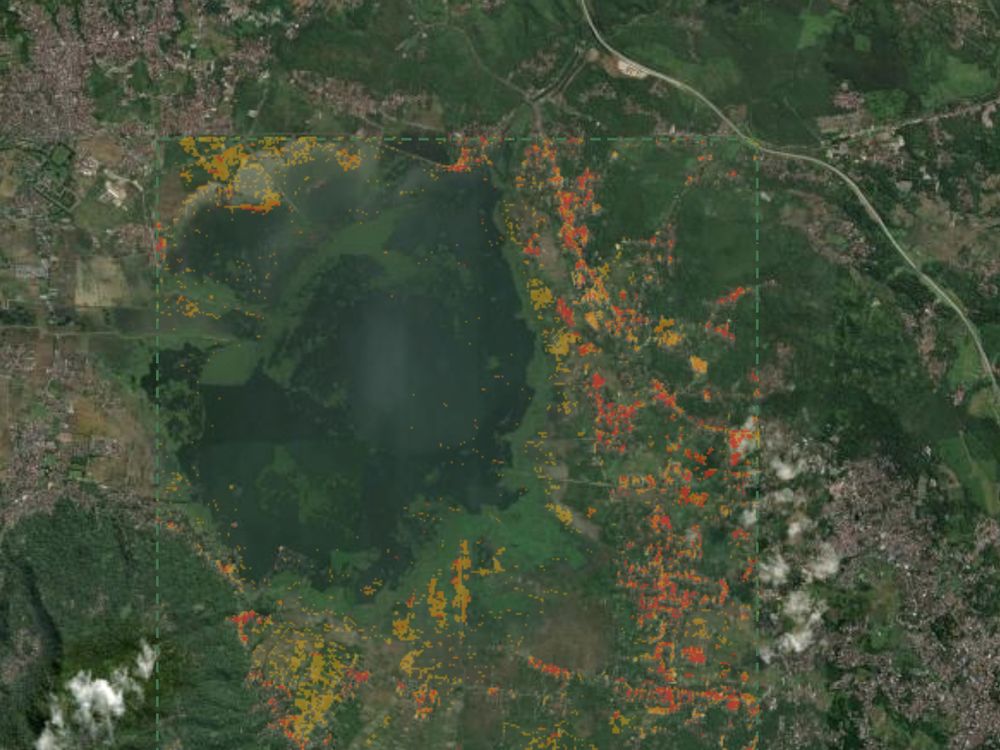
Floating vegetation72 possible mat zones205.2 ha of signal over 1,043.4 ha of open water, median confidence 0.77. It does not identify a species.
Shoreline change79 shoreline segments90.7 ha erosion, 43.4 ha accretion, split 49 retreat and 30 advance. Tide correction is not applied.
Vegetation health807.3 ha of NDVI decline100 stress zones at 98% valid coverage, 83% of the area inside the largest five. Riau.
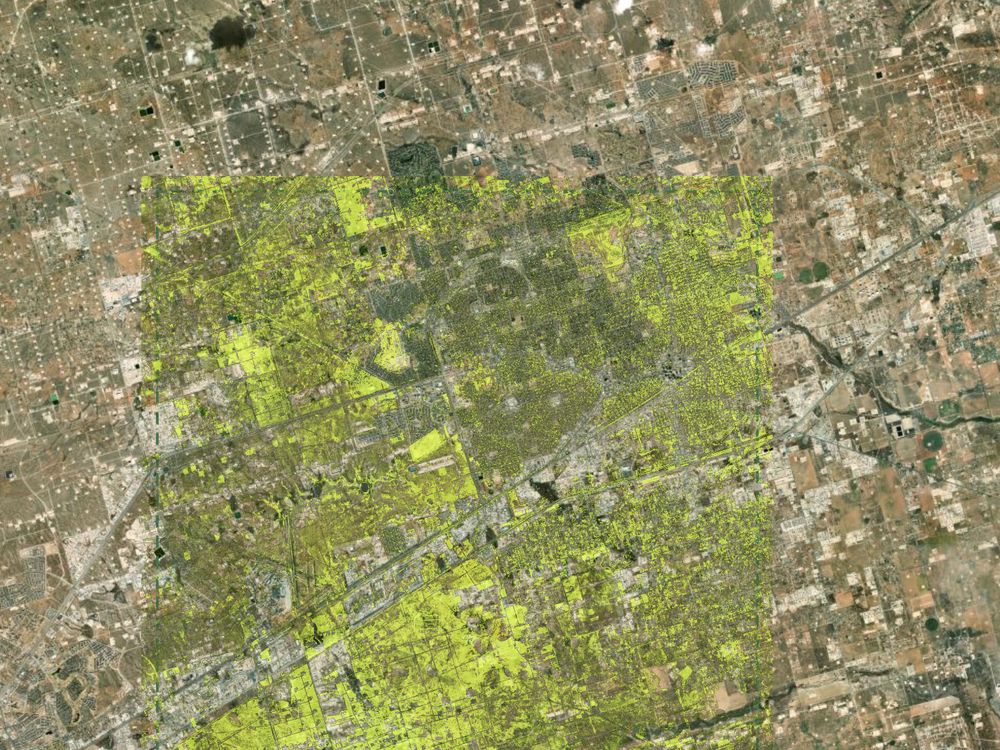
Canopy condition727.1 ha lower-relative canopy100 zones out of 3,480.8 ha of vegetation, at 80% clear coverage.
Vegetation phenology497.3 ha below expectationAcross 23 observations: 71 zones below expected, 29 above. A seasonal baseline, not a trend.
Industrial site lifecycle439.7 ha changed100 lifecycle zones over a 15-observation median: 5 new exposure, 65 persistent exposed.
Exposed ground371.0 ha screened as exposed100 zones at 93% clear coverage: 34 strong, 49 elevated, 17 watch.
Surface changeTop 100 of 331 candidates269.0 ha flagged at 95% valid coverage, median confidence 0.86. Candidates for review, not land-use labels.
Live environmentWind 0.4 m/s SWThe live wind field over an open-pit mine and its settling ponds, East Kalimantan.
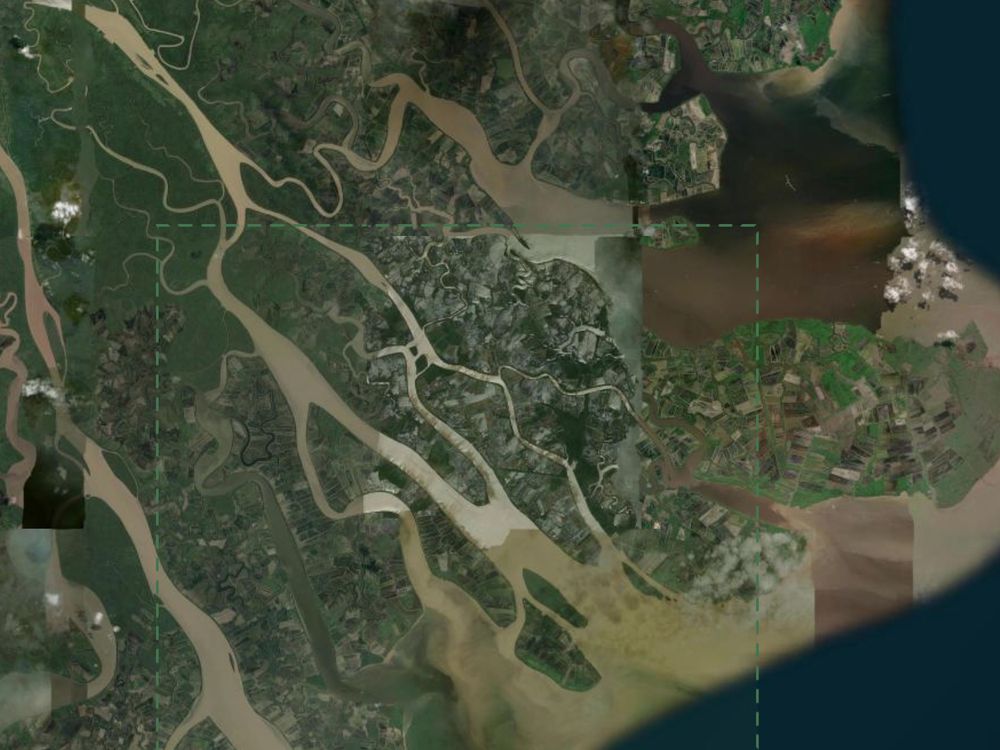
Mangrove trajectories0 trajectory zonesMahakam Delta, 2019 to 2022 to 2025. When nothing changed, the honest output is nothing.
Why teams pick Enviro
Built to be checked, not just believed.
Screening is labelled screening
Every analysis states whether its output is a screening indicator or a provider-validated measurement, and every candidate arrives with the reasons it might be wrong: cloud edge, shadow, harvest, drought, residual haze. The tool that tells you its limits is the one that survives review.
Shown before you run, not after. Tucker (1979) and Coppin et al. (2004) are working links.
Published methods, with citations
Multi-band, multi-pass methane detection follows Varon et al. (2021). Emission quantification uses integrated mass enhancement with Monte Carlo uncertainty. Change detection uses same-season median composites at 10 m. Hand the method to a reviewer and they can look it up.
Varon et al. (2021)Multi-band methane retrieval from Sentinel-2
Tucker (1979)The NDVI foundation, Remote Sensing of Environment 8
Coppin et al. (2004)Change-detection review, Int. J. Remote Sensing 25
No accounts to chase, no per-scene invoice
The core workflow runs on public Sentinel-2 L2A and Carbon Mapper’s open plume catalogue. Nothing to procure before your first result, and nothing that turns a wide-area screen into a budget conversation.
Every run stays reopenable
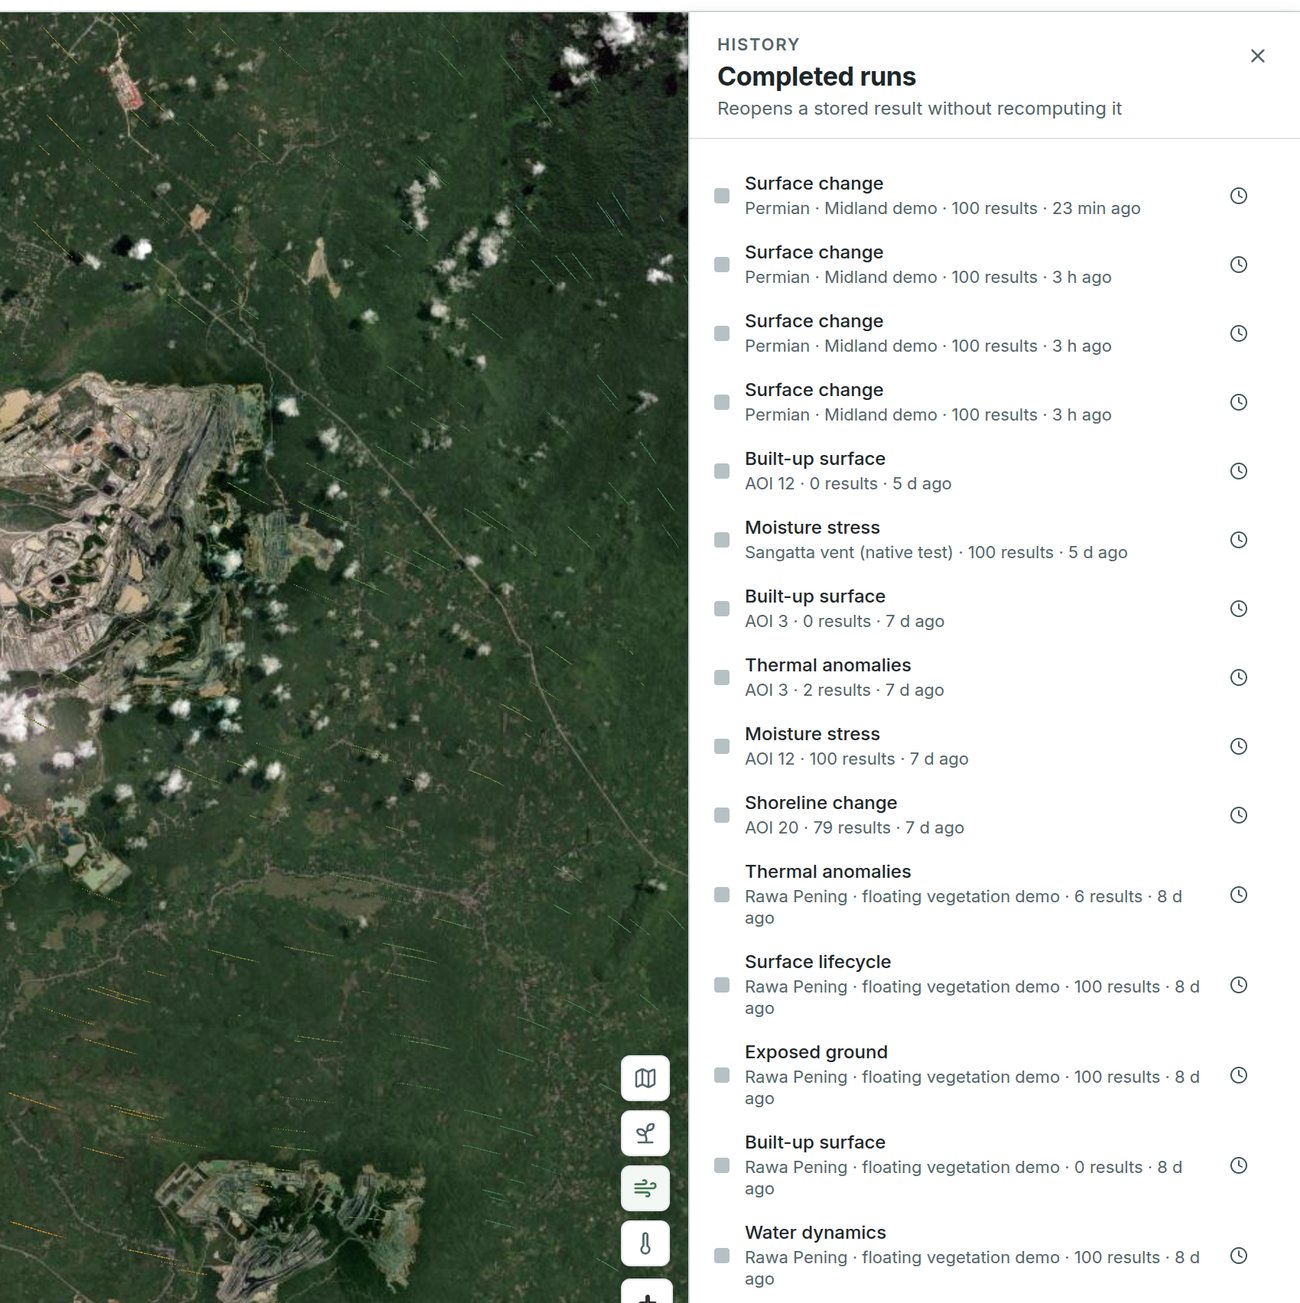
Results are stored with the scenes, dates and parameters that produced them. Reopen a run months later and it renders from what was saved. It does not recompute, and it cannot quietly change.
“Reopens a stored result without recomputing it.” Every completed run stays in the list with its area and result count.
Who it is for
Four teams, one workflow.
Carbon project developers
Blue-carbon and forest MRV: baseline extent, canopy trajectories, drainage canals and pond-conversion history per zone, dated and mapped and exportable for the validator’s file.
Concession & supply-chain compliance
Screen palm, mining and industrial sites for new clearing, exposed ground and pit water between audits, attributed to the named holder of the concession.
Government agencies & regulators
Watch coastlines, protected areas and permit boundaries across thousands of square kilometres without buying imagery or standing up a remote-sensing unit.
Banks, insurers & ESG teams
Independent, dated evidence on deforestation exposure, methane risk and site condition, in hand before it reaches a disclosure or a credit committee.
Method & limits
The limits, stated by us first.
Every serious buyer sends a technical reviewer. This is so that reviewer finds the limits from us, not later.
What you get
What it is
What it is not
Surface-change candidates
Ranked regions of significant vegetation loss at 10 m, from same-season composites
Not a land-use label. A candidate may be a well pad, road, clearing, harvest, fire or drought effect and still needs analyst review
Methane emission rates
Carbon Mapper’s published, quality-controlled values, clustered into persistent sources
Not our own retrieval. The public catalogue runs roughly 40 days behind
Our Sentinel-2 methane detector
Significance anomalies for review, on open data, with no account required
Detection only, with no emission rate. Sentinel-2’s physical floor is about 1 to 10 t CH₄/h on bright, uniform ground
Industrial heat sources
SWIR high-temperature anomalies that recur at the same place across independent observations
Not a temperature, a flare volume or a combustion rate. Sentinel-2 is not a calibrated thermal imager
Vegetation, water and coastal indices
Consistent, dated, reproducible screening indicators over your exact area
Not field measurements, and not a substitute for ground truth in a certified methodology
Every run
The scenes used, their dates, cloud cover and coverage, kept with the result
Nothing is produced from imagery you cannot see listed
Where a number needs an instrument we do not have, we say so and name the instrument that would get it. Quantified methane retrieval at about 300 kg/h needs NASA EMIT. That is on the roadmap, not in the product.
Marginal data cost is near zero, so the whole registry is free to run. What we charge for is your data, your methodology and your infrastructure.
Start hereFree$0foreverEverything the open data can answer
All 26 analyses, no feature gates
Areas up to 0.25° per side
Sentinel-2 and Carbon Mapper data included
Map results, CSV and raster export
Every run stored and reopenable
Runs in the browser: no GIS desktop, nothing to install
Start nowNo credit card. No imagery account.EnterpriseTalk to usFor the monitoring the free tier was never built to carry
Task fresh imagery on demand. Commission high-res tasking instead of waiting on Sentinel-2’s next five-day pass.
No area ceiling. Screen a whole concession portfolio, a province or a coastline in one run.
One workspace, your whole team. Shared areas, runs and exports, with role-based access.
Bring your own data. Drone and commercial imagery, your own surveys, your existing GIS layers.
Modify or build the analysis. New thresholds, new modules, built with our specialists.
Run it in your infrastructure. Private cloud or on-premise, behind your own firewall.
Talk to our teamSingle sign-on, data residency and support terms included. Most scopes start within a week.
Questions that actually arrive
Answers you can paste into a procurement email.
Do I need to buy satellite imagery?
No. The core workflow runs on free, public Sentinel-2 data. No imagery licence, no Copernicus or Earthdata account, no per-scene charge.
How fresh is the data?
Sentinel-2 revisits every five days, so optical analyses are typically days old. Carbon Mapper's public methane catalogue runs about 40 days behind.
How long does one analysis take?
The methane path returns in about 20 seconds. A full Sentinel-2 raster analysis over a 0.25 degree area currently takes 5 to 12 minutes end to end, and runs in the background while you work on something else.
How large an area can I analyse?
Up to 0.25 degrees per side in a single run today, roughly 28 km across at the equator. Larger areas are tiled; automatic tiling is on the roadmap.
Can I bring my own imagery?
Yes, on Enterprise. Drone surveys, commercial satellite tasking and your existing GIS layers can be brought into the same workflow, and the analyses can be adjusted to fit them.
Can I use these results in a certified carbon methodology?
As screening, monitoring and evidence, yes. Every run keeps the imagery, dates and parameters that produced it. As a substitute for the field measurements a methodology requires, no. We will tell you which is which for your specific standard.
How accurate is it?
It depends on the analysis, the site and the season, and we publish the failure modes for each one. What we guarantee is reproducibility: the same area, dates and scenes give the same result, and you can always see which imagery was used. A run that finds nothing reports nothing.
Is this a GIS replacement?
No. Enviro answers repeatable monitoring questions in minutes; it does not replace a full desktop GIS. Export the results as CSV and take them into your own stack whenever you need to.
Can we run it on our own servers?
Yes, on Enterprise. Enviro can be deployed into your private cloud or on-premise, so imagery and results never leave your infrastructure.
What if the analysis I need isn't there?
The registry is pluggable, so new analyses ship as modules on the same workflow. Tell us the question and the site; if it can be seen from orbit, we will tell you honestly whether it can be measured.
Pick a site you already worry about. Run it now.
One area, one analysis, one coffee. If Enviro cannot see what you need from orbit, you will know today instead of after a procurement cycle.